The rate of childhood asthma in Baltimore City is 20%—more than double the national average of 9%

Indoor and outdoor environment, health and nutrition, and neighborhood factors can cause asthma.

childrens lung health matrix

Welcome to the BREATHE Center’s interactive report on risk factors associated with children's respiratory health.

Did you know that genetics only accounts for less than half of asthma severity?

The BREATHE Center focuses on other risk factors that impact asthma severity including exercise, nutrition, exposure to allergens and chemicals, and social determinants of health—the conditions in the environments where people are born, live, learn, work, play, worship, and age.1

Keep scrolling to learn more.

slider thumb image

Smoking seven or more cigarettes indoors each day can cause issues for people with breathing problems like Asthma

Baltimore has a higher smoking rate than Maryland and the United States

Cooking three or more times a day on a gas stove creates an unhealthy environment

Most census tract areas use primarily either gas or electric to heat their homes, few have a mix of both

The transition away from utility gas heating to electric heating is slow

Indoor Environment

BREATHE Center studies have shown that children living in Baltimore City often live in homes where the indoor air quality is worse than outdoor air quality.

In a study of preschool children's homes, the average fine particle pollution in the air was 40 micrograms per cubic meter of air (µg/m3) while average outdoors was 10 µg/m3.2 That’s four times the amount of particulate matter inside versus outside.

But what is fine particulate air pollution, known as PM2.5, and why should you care?

PM2.5 Size
Fine particle air pollution, known as PM2.5, can travel deep into the respiratory tract, reaching the lungs and entering the blood stream.

PM2.5 and Risk
PM2.5 at or below 5 μg/m3 has little to no risk from exposure. If the level goes above 5 μg/m3, the air is considered unhealthy for people with existing breathing issues such as asthma.3 The average indoor PM2.5 level in Baltimore was 40 μg/m3.

Common PM2.5 Sources
Outdoors, PM2.5 is produced by vehicle exhaust and fuel burning. Indoors, PM2.5 is produced by smoking, cooking, and using fireplaces.

Smoking indoors not only affects the person smoking, but others who are in the space. Indoor PM2.5 exposure is associated with poorer respiratory and cardiovascular outcomes.

Baltimore’s smoking rate has been consistently above state and national averages since 2002. Although all rates were decreasing at a similar pace initially, since 2008 Baltimore’s rate has been declining less rapidly, widening the gap between the city and the rest of the state and the country. As of 2016, Baltimore City was still five years behind Maryland in terms of reducing smoking rates.

Baltimore residents who are 26+ years old are driving the difference in smoking rates between Maryland and Baltimore City. On the other hand, younger age groups seem to have smoking rates comparable to other locations.
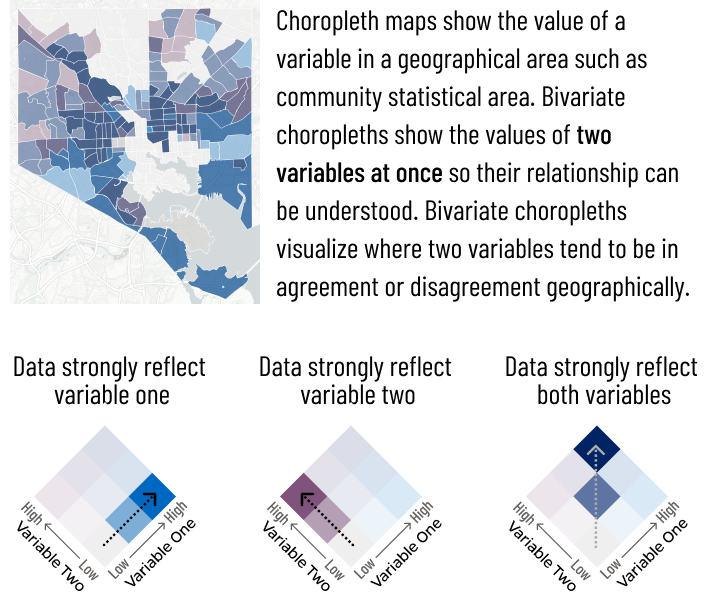
The number of adults who smoke is not evenly distributed across the city. In the map on the left, the darker the area, the more adults living there smoke. These differences occur because smoking habits are shaped by different social circumstances.

Drag the slider to compare adult smoking rates to the change in smoking rates between 2002 and 2016. The darker blue areas mean there was a significant decrease in smoking prevalence. The dark purple areas mean there was an increase.

Gas stoves are another source of indoor particulate matter. Cooking on a gas stove three or more times a day without proper ventilation increases PM2.5 to unhealthy levels, especially for those already experiencing breathing issues such as asthma.

Gas is the most commonly used resource to heat homes in Baltimore City and it is also responsible for increases in PM2.5 inside and around homes with active service lines.

Most of the homes in Baltimore City are being heated by gas. Only a few areas, mostly in the downtown area, are predominantly using electricity.

In terms of gas use, Baltimore City is above US, Baltimore Metropolitan Area, and Maryland with more than 60% of homes using gas versus 35-45% in other geographies.

Another indoor exposure of concern is allergens from animals, especially pests like mice and cockroaches. Exposure to an allergen found in mouse urine that is circulating in the air increases the risk for developing allergic sensitivity. For children who have allergic asthma, exposure to these allergens can worsen their asthma, doubling the risk of needing to go to the emergency room.4

Take Action

Improving air quality at home is a great way to improve indoor environment and reduce the risk of new or aggravated breathing issues.

Using HEPA air filtration reduces indoor PM2.5 by 30-60%

Increase the frequency of laundering bed linens

For children with allergic asthma, it’s helpful to add air purifiers, launder bed linens frequently, add allergen covers for mattress and pillows, and keep food that might attract mice out of bedrooms.

Dark blue areas mark areas where asthma and obesity are both highly prevalent

Baltimore City Healthy Food Priority Areas largely overlap with areas where both asthma and obesity rates are high

Health and Nutrition

Many factors related to health and nutrition overlap with the presence of asthma. This includes obesity, the availability of nutritious foods, other diseases such as diabetes, and income.

The relationship between health and income is part of social determinants of health—the idea that conditions in the environments where people are born, live, learn, work, play, worship, and age affect a wide range of health, functioning, and quality-of-life outcomes and risks.

In Baltimore, obesity and asthma are both highly prevalent in the same areas. The co-occurence of obesity and asthma may be caused by lack of sufficient nutrients and exercise.

The Center for Disease Control has found that only one in four children get the recommended 60 minutes of exercise per day5 and that less than half eat the recommended amount of fruits and vegetables each day.6

The combination of an imbalanced diet and increased indoor air pollution may be especially harmful for children with obesity and asthma.

BREATHE research shows that balanced nutrition is good for lung health and that low vitamin D increases susceptibility to PM2.5 among overweight children.

Their studies have also shown that more than half of children had low vitamin D.7 Children and adults who do not consume foods rich in vitamin D are more likely to be susceptible to indoor air pollutants.

Foods rich in Vitamin D include fatty fish like trout, salmon, and tuna; egg yolks, cheese, and milk with added vitamin D.

In addition to Vitamin D, Omega-3 fatty acids are another important part of a healthy diet. Omega 3 fatty acids have even been found to protect against the harmful effects of air pollution. BREATHE Center studies show that most children have Omega-3 intake below recommended levels, which are typical of an American style diet.8

Sources of Omega-3 are: cold-water fatty fish like salmon, mackerel, tuna, herring, and sardines; nuts and seeds like flaxseed, chia seeds, and walnuts; plant oils such as flaxseed oil, soybean oil, and canola oil; and fortified foods which includes certain brands of eggs, yogurt, juices, milk, and soy beverages.

The co-occurrence between obesity and asthma isn't random. Areas of high prevalence follow clear geographic boundaries that mirror Redlining—the historical practice of excluding of Black Americans from access to housing. In Baltimore, this has created what Dr. Lawrence Brown dubbed the Black Butterfly.

Poor nutrition contributes to health outcomes which may be caused in part by the limited or nonexistent supply of nutritious foods in the Black Butterfly.

In partnership with the John’s Hopkins Center for a Livable Future, the Baltimore City Department of Planning is prioritizing the availability of healthy food like fresh produce and unprocessed packaged foods in areas where median income is low, more than 30% of residents do not have a vehicle, and the distance to a supermarket is more than 1/4 mile.9

Take Action

Improving health and nutrition by exercising and eating foods rich in vitamin D and Omega-3 can reduce the risk of new or aggravated breathing issues.

Find markets and grocery stores that accept SNAP

Explore Baltimore farmers markets and grocery stores that accept SNAP/EBT.

Contact your city council person about the healthy food initiative

Start a new exercise routine and improve your diet

Exercise and diet are the best ways to improve lung health, but change is hard! Set yourself up for exercise success and try making small adjustments to your diet.

Asthma in Baltimore City is concentrated in the center of the city with the exception an L-shape in the middle

The placement of known pollutant producing locations doesn't always coincide with lower residential population

The northern and western areas of Baltimore have a higher percentage of area covered by trees

Places with the lowest percentage area covered by trees intersect with historically redlined areas

Life expectancy is lower in areas closer to the city center

Neighborhood

Asthma rates are affected by many factors such as home conditions and health and diet, however there are other external factors that can impact asthma prevalence.

The relationship between geography, health, and income is part of social determinants of health—the idea that conditions in the environments where people are born, live, learn, work, play, worship, and age affect a wide range of health, functioning, and quality-of-life outcomes and risks.

For example, Asthma is concentrated in the center of the Baltimore with the exception of a strip up the middle from the harbor. The darker shades toward the middle of the map indicate that there is a higher prevalence of asthma in those areas and the lighter shades indicate a lower prevalence of asthma.

The map clearly shows that the distribution of Baltimore residents affected by asthma is not equal. This is due to social determinants of health.

There are other health-related issues that follow the same geographic pattern as asthma. These geographic patterns mean that asthma and other health factors are not isolated.

The darker areas on the maps are more heavily impacted by multiple health conditions, not only asthma. These patterns highlight the need for support and resources in these communities.

Non-medical factors such as income also impact our health. The patterns in health factor prevalence also closely follow the income patterns in the city.

All of the graphs show that there is a trend for decreasing disease prevalence as income increases.

In this set of examples, income is not a direct cause or result of health conditions, but both are affected by one another.

Health can also be affected by environmental conditions in the neighborhoods where people live. Trees filter particles out of the air we breathe and provide cooling shade, both of which affect our risk of asthma and other respiratory illnesses.

It may be obvious that different neighborhoods throughout Baltimore have different amounts of trees, but what might be less apparent is that some of these differences can be traced back to redlining—a racially-discriminatory mortgage lending practice pervasive from the 1930s–60s.10

Redlined areas have fewer trees. Residents of these predominantly-Black neighborhoods have been excluded from the many protections trees can offer while being subjected to the additional risks imposed by a sparse tree canopy.

In Baltimore, the lack of tree canopy is sometimes compounded with the presence of harmful pollutants produced by nearby chemical plants, treatment facilities, etc.

The locations of incinerators and pollutant producing industrial plants in Baltimore like those mapped here is another neighborhood factor to consider.

These facilities contribute to worsening the overall air quality of Baltimore, especially for residents who live close to them.

Historic and ongoing systemic racial discrimination practices continue to affect the health of Baltimoreans.

Life expectancy for areas with more non-white and low-income residents is much lower that for predominantly white and higher income areas.

It’s the responsibility of Baltimore City, Maryland, and Federal governments to invest in equality, but there are many small steps that families can take on their own to improve their neighborhood and health outcomes.

Take Action

Improving the air quality of the environment around your home can decrease the risk of asthma symptoms.

Get involved in Baltimore’s Complete Streets program

Baltimore’s Complete Streets program is currently the largest roadway planning initiative in Baltimore City.

Apply for a free tree for your yard, street, or community

Through TreeBaltimore, trees are provided to Baltimore City residents in an effort to increase Baltimore City's Tree Canopy. Sign up to get a free tree!

Explore housing options in Baltimore’s green neighborhoods

LiveBaltimore allows you to filter for green neighborhoods in your price range.

Outdoor Environment

Outdoor air quality is worsened with byproducts from power plants, industry, and cars.

Pollutants from burning fuel include PM2.5 and nitrogen oxide (NO2). These pollutants, along with weather changes, contribute to changes in air quality.

For individuals struggling with breathing problems such as asthma, spending time outside when the air quality is bad could worsen symptoms.

Outdoor air quality, particulate matter, and nitrogen oxide (NO2) change throughout the seasons. The three graphs on the right show Baltimore City trends over a three-year period.

Increased levels in the winter are attributed to higher emissions as a result of indoor heating and a pollution “trapping” weather effect known as a temperature inversion.

Increased levels in the summer, on the other hand, are attributed to heightened ozone levels that increase with rising temperatures and more direct sunlight.

In the past ten years, AQI, PM2.5, and NO2 have been trending downward meaning that there is less pollution in Baltimore’s air.

Not one single policy can explain the improvement in air quality, but it is a great sign for Baltimoreans!

Different weather patterns can contribute to worsened breathing conditions.

Cold weather can trigger the narrowing of airways, known as bronchoconstriction, making it more difficult to breathe.

Hard rain from thunderstorms breaks up large grains of pollen into smaller, easier to inhale particles.

Heat and humidity provide a good environment for mold and dust mites to grow. On hot, sunny days pollutant emissions from industry and cars cause poor ozone quality which also contributes to worsened breathing conditions.

Take Action

Understanding, monitoring, and responding to changes in air quality because of pollution, allergens, and weather can be a helpful way to reduce asthma symptoms.

Monitor the air quality near you by looking at AirNow

The Environmental Protection Agency's site on air quality gives your area's Air Quality Index (AQI). Based on the AQI, you can tell if air quality could affect your asthma.

Receive pollen count alerts from the National Allergy Bureau

Sign up to receive email alerts or download the app from the AAAAI to alert you of your area’s pollen counts.

Learn more from the American Lung Association

The American Lung Association has a lot of resources on research, advocacy, and education on lung health.

To explore Baltimore lung health data in more detail view on a larger screen.

Indoor Environment

Health & Diet

Neighborhood

Demographics

close

How to read bivariate choropleth maps

Sources

Text references are numbered and correspond to numbers throughout. Data references are listed within under their corresponding section. Please contact rkoehl1@jhmi.edu for questions regarding the sources of information for this project.


Indoor Environment

1. “Social Determinants of Health.” Social Determinants of Health - Healthy People 2030. Accessed August 2, 2023. https://health.gov/healthypeople/priority-areas/social-determinants-health.

2. “In a study of preschool children's homes, the average fine particle pollution in the air was 40 micrograms per cubic meter of air (µg/m3) while average outdoors was 10 µg/m3.”

3. “PM2.5 at or below 5 μg/m3 has little to no risk from exposure. If the level goes above 5 μg/m3, the air is considered unhealthy for people with existing breathing issues such as asthma.”

4. Ahluwalia, Sharon K et al. “Mouse Allergen Is the Major Allergen of Public Health Relevance in Baltimore City.” The Journal of allergy and clinical immunology, June 26, 2013. https://pubmed.ncbi.nlm.nih.gov/23810154/

“Nsduh Substate estimates. Accessed August 2, 2023. https://pdas.samhsa.gov/saes/substate

Bureau, US Census. “Home Heating Fuel.” Census.gov, March 1, 2022. https://data.census.gov/table?tid=ACSDP5Y2021.DP04

Health and Nutrition

5. “Youth Physical Activity Guidelines | Physical Activity | Healthy Schools | CDC.” Centers for Disease Control and Prevention, Center for Disease Control, https://www.cdc.gov/healthyschools/physicalactivity/guidelines.htm. Accessed 19 Sept. 2023.

6. “Percentage of Adolescents Meeting Federal Fruit and Vegetable Intake Recommendations — Youth Risk Behavior Surveillance System, United States, 2017 | MMWR.” Centers for Disease Control and Prevention, Center for Disease Control, 21 Jan. 2021, https://www.cdc.gov/mmwr/volumes/70/wr/mm7003a1.htm?s_cid=mm7003a1_w.

7. Bose S, Diette GB, Woo H, Koehler K, Romero K, Rule AM, Detrick B, Brigham E, McCormack MC, Hansel NN. “Vitamin D Status Modifies the Response to Indoor Particulate Matter in Obese Urban Children with Asthma. “J Allergy Clin Immunol Pract. 2019 Jul-Aug. https://pubmed.ncbi.nlm.nih.gov/30763731/

8. Brigham EP, Woo H, McCormack M, Rice J, Koehler K, Vulcain T, Wu T, Koch A, Sharma S, Kolahdooz F, Bose S, Hanson C, Romero K, Diette G, Hansel NN. Omega-3 and Omega-6 Intake Modifies Asthma Severity and Response to Indoor Air Pollution in Children. Am J Respir Crit Care Med. 2019 Jun 15. https://www.atsjournals.org/doi/epdf/10.1164/rccm.201808-1474OC

9. City of Baltimore. (2023, August 17). Mapping & Data. Department of Planning. https://planning.baltimorecity.gov/baltimore-food-policy-initiative/food-environment

“Arcgis Hub.” Healthy Food Priority Areas 2018, 2018. https://hub.arcgis.com/maps/9f6e3610009842a6ba2ecf6292d69046/about

Neighborhood

10. Locke, D.H., Hall, B., Grove, J.M. et al. Residential housing segregation and urban tree canopy in 37 US Cities. npj Urban Sustain 1, 15 (2021). https://doi.org/10.1038/s42949-021-00022-0

“Places: Local Data for Better Health.” PLACES: Local Data for Better Health, July 13, 2023. https://www.cdc.gov/places/index.html

Percent of area covered by trees. Open Baltimore. (n.d.). https://data.baltimorecity.gov/maps/bniajfi::percent-of-area-covered-by-trees-1/about

“Map of Commercial Waste Combustors in the U.S.” EPA. Accessed August 2, 2023. https://www.epa.gov/hwgenerators/map-commercial-waste-combustors-us

“Life Expectancy at Birth for U.S. States and Census Tracts, 2010-2015.” National Center for Health Statistics, March 9, 2020. https://www.cdc.gov/nchs/data-visualization/life-expectancy/index.html

Environment

“AirData Website File Download Page.” EPA. Accessed August 2, 2023. https://aqs.epa.gov/aqsweb/airdata/download_files.html